Triple Top and Triple Bottom Patterns: How to Trade Them
Triple Top and Triple Bottom Patterns: A Beginner’s Guide

Triple Top and Triple Bottom Patterns: Key Insights for Traders
The Triple Top and Triple Bottom patterns are advanced reversal patterns in technical analysis. These patterns indicate that the market has tested key support or resistance levels multiple times, and a trend reversal may be imminent. Recognizing these patterns and understanding the market conditions in which they form is essential for traders looking to anticipate significant price movements.
Before diving into the details of triple top and triple bottom patterns, it’s valuable to understand the Triangle Patterns: Profitable Strategies. These patterns, similar to triple top and triple bottom formations, offer traders insights into price movements and key breakout opportunities.
Triple Top Pattern: Bearish Reversal in a Bullish Market
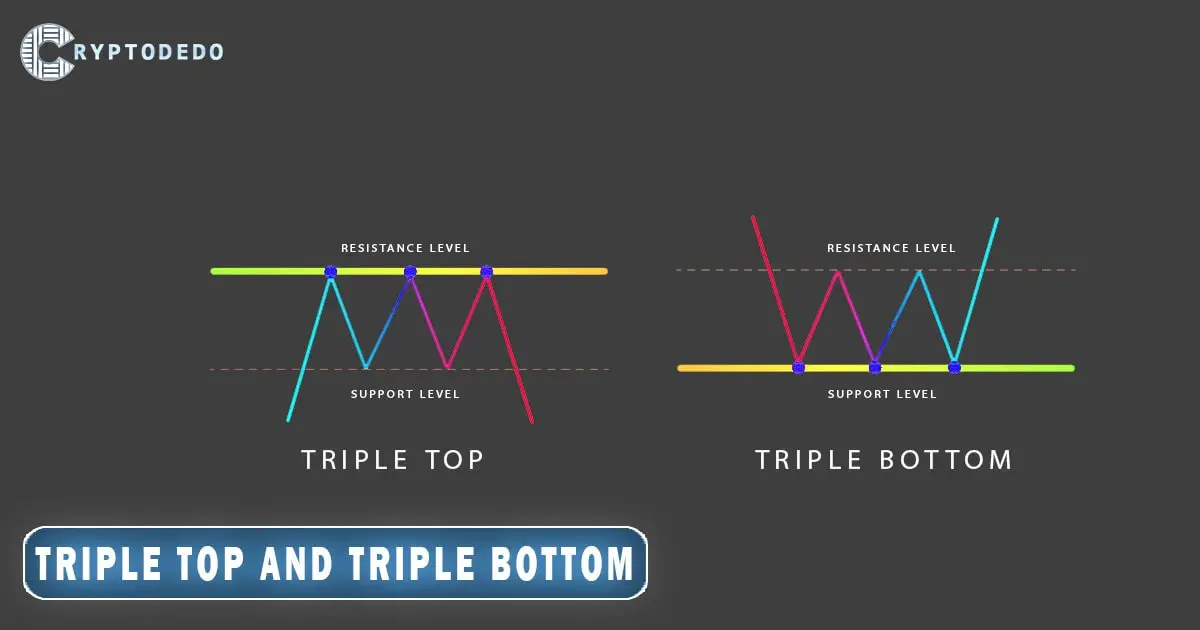
The Triple Top pattern typically appears after an extended uptrend and signals that the market is likely to reverse into a downtrend. It forms when the price tests a key resistance level three times but fails to break through. Here’s how the market conditions contribute to this pattern:
Prolonged Uptrend: The market has been in a steady upward trend, driven by strong bullish sentiment. Buyers continue to push the price higher, but the momentum begins to slow as the price nears resistance.
First Top: The price reaches a resistance level and is rejected. This signals the first indication of weakness, but the general sentiment remains bullish, and buyers attempt to push the price higher again.
Second Top: After a brief pullback to the support level, the price rises again and hits the same resistance level, only to be rejected once more. This second failure increases the likelihood that buyers are losing strength.
Third Top: The price rallies once again but fails to break the resistance for the third time. This triple rejection indicates that the buying pressure has significantly weakened.
Breakdown: When the price falls below the support level following the third rejection, it confirms the bearish reversal. Traders often interpret this as the start of a downtrend and may begin taking short positions or selling to avoid further losses.
In essence, the Triple Top pattern forms in markets where buyers have exhausted their strength after a long uptrend, and selling pressure is starting to take over.
Triple Bottom Pattern: Bullish Reversal in a Bearish Market
The Triple Bottom pattern, on the other hand, indicates a bullish reversal after a downtrend. It forms when the price tests a key support level three times but fails to break below, signaling that the downtrend may be coming to an end. Here’s how the market conditions contribute to this pattern:
Prolonged Downtrend: The market has been in a steady decline, driven by strong bearish sentiment. Sellers continue to push the price lower, but the downward momentum starts to slow as the price nears a major support level.
First Bottom: The price reaches a support level and bounces upward, indicating that buyers are starting to enter the market, but the general bearish sentiment remains.
Second Bottom: After a small upward move, the price pulls back to the support level again but fails to break below it. This second test shows that the support is holding, and buying pressure may be increasing.
Third Bottom: The price tests the support level for the third time and once again fails to break below. This triple failure indicates that sellers are losing control, and buyers are becoming stronger.
Breakout: When the price breaks above the resistance level following the third bottom, it confirms the bullish reversal. Traders often interpret this as the start of an uptrend and may enter long positions, expecting further upward movement.
The Triple Bottom forms in markets where sellers have exhausted their strength after a long downtrend, and buying pressure is beginning to dominate.
Triple Top and Triple Bottom Patterns: Market Sentiment and External Factors
In both patterns, the market sentiment is a key factor:
Triple Top patterns typically appear when market optimism has driven prices higher, but growing doubt and increasing resistance at key levels cause the uptrend to weaken. Traders start to anticipate a correction.
Triple Bottom patterns usually form when pessimism has driven prices lower, but support holds firm, signaling that the bearish momentum is waning and the market may recover.
External factors such as economic reports, earnings data, geopolitical events, or changes in market fundamentals can also accelerate the formation of these patterns, as they shift trader sentiment and affect the supply-demand dynamics.
Conclusion
The Triple Top and Triple Bottom patterns are valuable tools for identifying market reversals in specific conditions. The Triple Top forms in a bullish market nearing exhaustion, signaling a potential shift to a downtrend, while the Triple Bottom occurs in a bearish market showing signs of recovery, indicating a potential uptrend. Understanding the broader market context in which these patterns form helps traders make informed decisions and avoid false signals.


