Rectangle Patterns: How to Trade Them
A Guide to Rectangle Patterns in Crypto Trading

Rectangle Patterns in Cryptocurrency Trading
The Rectangle Pattern is a common continuation pattern in technical analysis that signals a period of consolidation before the price continues in the direction of the previous trend. It forms when the price moves within a horizontal range, bouncing between a consistent support and resistance level.
Traders watch these patterns closely to anticipate when the price will break out of the range, providing an opportunity for entering positions.
This pattern can be bullish or bearish, depending on the direction of the breakout. Let’s explore the structure, how the market conditions contribute to its formation, and how traders can use it in their strategies.
- While mastering Rectangle Patterns, also explore our guide on profitable strategies using Triangle Patterns.
Bullish Rectangle: Continuation of an Uptrend
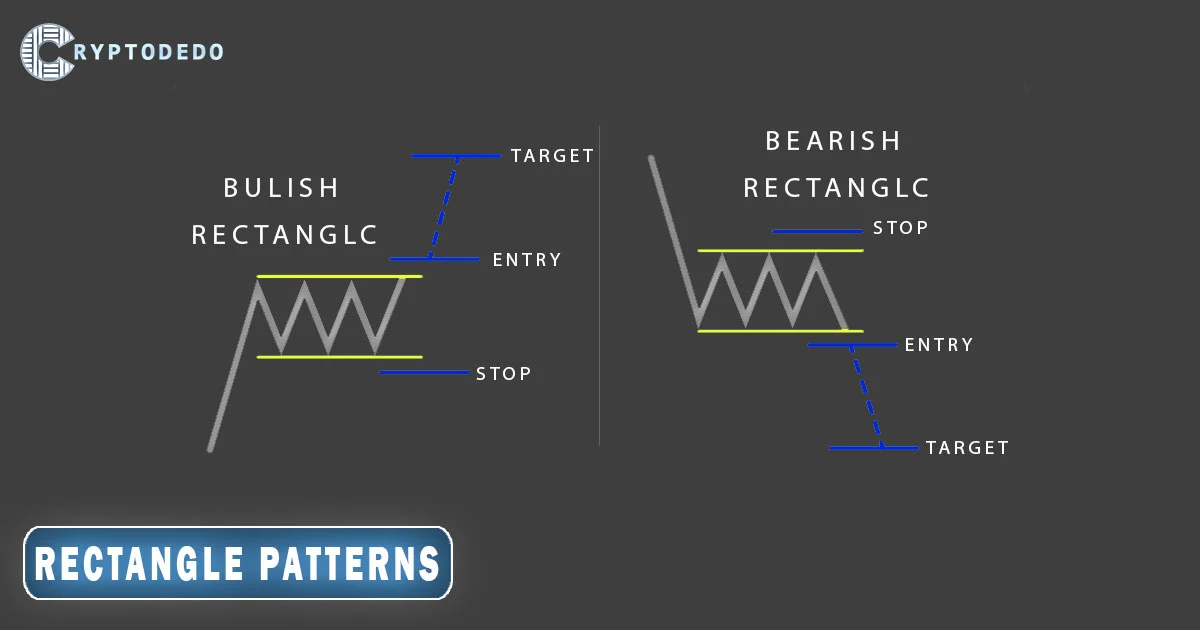
A Bullish Rectangle pattern typically forms in the middle of an uptrend. It indicates that, after a significant price increase, the market is temporarily consolidating before resuming its upward movement. Here’s how this pattern develops:
- Uptrend Before the Rectangle: The market has been in a clear uptrend, where strong buying pressure has driven prices higher.
- Consolidation Phase: The price enters a horizontal consolidation phase, moving between a resistance level at the top and a support level at the bottom. This range-bound movement indicates that neither buyers nor sellers have enough strength to push the price outside the range. It reflects a balance in market forces, with buyers taking profits and waiting for more momentum to build, while sellers struggle to reverse the trend.
- Breakout: The pattern completes when the price breaks out above the resistance level, signaling the continuation of the uptrend. This breakout is a sign that buyers have regained control, and the price is likely to rise further. Traders often enter long positions at this point, targeting a price move that’s roughly the height of the rectangle.
Market Conditions for Bullish Rectangle
The bullish rectangle pattern typically forms in strong bullish markets when buying pressure is dominant, but the market takes a temporary pause. This pattern can be seen in stocks or assets with solid fundamentals, positive sentiment, or bullish news driving demand. Traders expect the price to continue rising once the consolidation phase ends.
Bearish Rectangle: Continuation of a Downtrend
A Bearish Rectangle pattern appears during a downtrend, signaling that the market is pausing before continuing to fall. Here’s how it forms:
- Downtrend Before the Rectangle: The price has been in a clear downtrend, driven by strong selling pressure.
- Consolidation Phase: The price moves sideways within a horizontal range, bouncing between a consistent resistance and support level. Similar to the bullish rectangle, this phase indicates a period of indecision where sellers are taking a break, and buyers are unable to reverse the trend. However, the overall market sentiment remains bearish.
- Breakdown: The pattern completes when the price breaks below the support level, signaling that the downtrend is resuming. Sellers regain control, and traders often enter short positions at the breakdown, expecting further downward movement. The price target is often the height of the rectangle projected downward from the breakout point.
Market Conditions for Bearish Rectangle
The bearish rectangle pattern forms in bearish markets, where selling pressure dominates, but the market temporarily consolidates. It is often seen in markets with weak fundamentals, negative sentiment, or bearish news affecting the asset’s value. Traders anticipate that the price will continue falling after the consolidation phase ends.
Key Characteristics of Rectangle Patterns
- Trend Continuation: Both bullish and bearish rectangle patterns are continuation patterns, meaning they signal that the previous trend will resume once the price breaks out of the consolidation range.
- Volume: Volume typically decreases during the consolidation phase and then spikes during the breakout (bullish) or breakdown (bearish). A volume increase at the point of the breakout or breakdown confirms the validity of the pattern and strengthens the signal.
- Market Sentiment: Rectangle patterns form when the market is indecisive but aligned with the prevailing trend. In a bullish rectangle, traders expect the uptrend to continue after the consolidation, while in a bearish rectangle, they expect the downtrend to resume.
Trading Strategies Using Rectangle Patterns
To trade the Rectangle Pattern, traders typically wait for the price to break out of the range to confirm the continuation of the trend. Key strategies include:
- Entry Points: Traders enter a long position after the price breaks above the resistance level in a bullish rectangle or enter a short position after the price breaks below the support level in a bearish rectangle.
- Stop Loss Placement: Stop-loss orders are usually placed below the support level for bullish rectangles and above the resistance level for bearish rectangles. This limits the risk if the breakout or breakdown turns out to be a false signal.
- Price Target: The price target is typically calculated by measuring the height of the rectangle and projecting that distance from the breakout (in bullish patterns) or breakdown (in bearish patterns) point.
Conclusion
The Rectangle Patterns are valuable continuation patterns that provide traders with clear entry and exit points in trending markets. The Bullish Rectangle indicates that an uptrend will likely continue after a consolidation phase, while the Bearish Rectangle suggests that a downtrend will resume after a temporary pause.
Understanding the market conditions in which these patterns form can help traders anticipate breakouts or breakdowns and make more informed trading decisions. Using volume analysis and setting appropriate stop-loss and target levels can increase the chances of success when trading rectangle patterns.


