Price Channels: A Guide to Profitable Trading
How to Trade with Price Channels Effectively

Price Channels Explained for Beginners
Price channels are a popular technical analysis tool used by traders to identify trends, monitor price movements, and make informed trading decisions. A price channel is formed by drawing two parallel trendlines that contain the price action within a particular range. Price channels help traders recognize potential breakout points, continuation patterns, and reversal opportunities, making them a versatile tool for different trading styles.
This article will explore the three main types of price channels—ascending, descending, and horizontal—explaining their structures and how to trade them effectively.
What is a Price Channel?
A price channel is a range within which a financial asset’s price fluctuates over time. It consists of two lines:
- Upper Trendline: Acts as a resistance level, capping the asset’s price within the channel.
- Lower Trendline: Serves as a support level, preventing the price from dropping below a certain level.
The price of the asset typically moves within this channel, bouncing off the upper and lower trendlines until it eventually breaks out in one direction. Price channels provide traders with a clear framework for identifying entry and exit points based on the trend direction.
False Breakouts
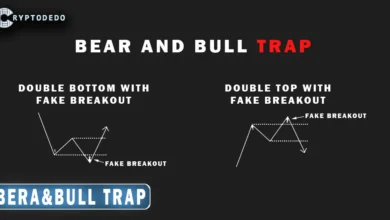
Breakouts from price channels can sometimes be deceptive, leading to potential losses. Traders often mistake these false breakouts for genuine trend reversals or continuations. To avoid falling into such traps, it’s essential to understand bull and bear traps and how they can mislead traders.
Learn more about identifying and avoiding these traps in our comprehensive guide on Bull and Bear Traps.
Types of Price Channels
-
Ascending Channel
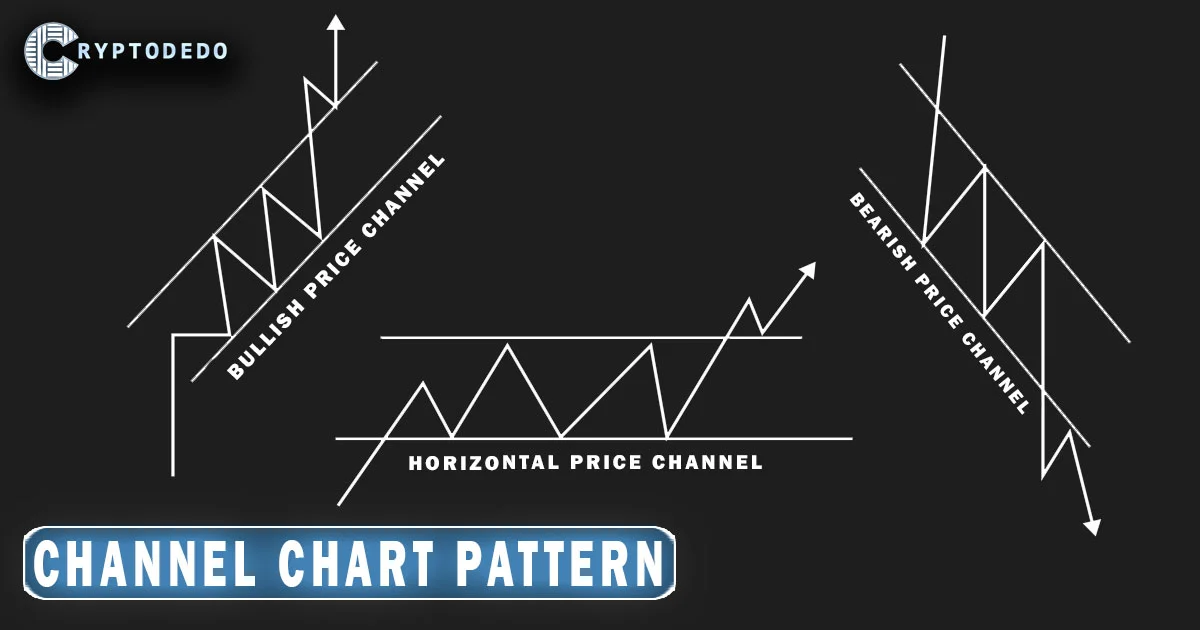
- Structure: An ascending channel, also known as an uptrend channel, is formed by drawing two parallel trendlines that slope upward. The price moves between the upper resistance line and the lower support line, creating higher highs and higher lows.
- Implication: An ascending channel indicates a bullish trend, suggesting that the asset’s price is gradually increasing.
- Trading Strategy: Traders typically look for buying opportunities near the lower support line and may consider selling when the price approaches the upper resistance line. A breakout above the resistance line may signal a continuation of the bullish trend, while a breakdown below the support line may suggest a trend reversal to the downside.
-
Descending Channel
- Structure: A descending channel, or downtrend channel, is characterized by two downward-sloping parallel lines. The price creates lower highs and lower lows within this range, bouncing between the resistance and support levels.
- Implication: A descending channel signals a bearish trend, indicating that the asset’s price is gradually declining.
- Trading Strategy: In a descending channel, traders generally look for selling opportunities near the upper resistance line and may consider buying when the price reaches the lower support line for a short-term rebound. A breakout above the resistance line may indicate a reversal to an uptrend, while a breakdown below the support line can suggest continued bearish momentum.
-
Horizontal Channel
- Structure: A horizontal channel, also known as a sideways channel or range-bound market, is formed by two horizontal trendlines that contain the price within a flat range. The price fluctuates between support and resistance levels without a clear upward or downward trend.
- Implication: A horizontal channel represents market indecision, where neither bulls nor bears dominate, and the asset’s price moves sideways.
- Trading Strategy: Traders can buy near the support line and sell near the resistance line, capturing short-term gains as the price oscillates within the channel. A breakout above the resistance level can signal the start of an uptrend, while a breakdown below the support line may indicate the beginning of a downtrend.
How to Draw Price Channels
Drawing a price channel accurately is essential for effective analysis. Here’s a simple method for drawing each type of channel:
- Identify the Trend: Determine if the price is trending up, down, or moving sideways.
- Draw the Support Line: For an uptrend, connect the lows of the price movement. For a downtrend, connect the highs.
- Draw the Resistance Line: Draw a parallel line to the support line. In an uptrend, this line connects the highs, while in a downtrend, it connects the lows.
- Adjust as Needed: Make minor adjustments to ensure both lines capture the majority of price action within the channel.
Using price channels with precision helps traders identify critical support and resistance levels where price movement is likely to react.
Trading Strategies Using Price Channels
- Bounce Strategy
- Description: This strategy involves trading the price as it bounces off the support and resistance lines within the channel.
- Application: In an ascending channel, traders can buy at the support line and sell near the resistance line. Conversely, in a descending channel, traders may short-sell near the resistance and take profit at the support line.
- Breakout Strategy
- Description: A breakout occurs when the price moves outside the channel, indicating a potential trend reversal or continuation.
- Application: In an ascending channel, a breakout above the resistance line may signal strong bullish momentum, prompting a buy position. In a descending channel, a breakout above the resistance can indicate a trend reversal, providing an opportunity to go long. Similarly, a breakdown below the support line in either an ascending or descending channel suggests a bearish signal, ideal for short positions.
- Channel Trend Following
- Description: Traders follow the overall trend within the channel, adjusting their trades based on the general direction.
- Application: In an ascending channel, traders may take long positions and add more on pullbacks, gradually increasing their position as the trend strengthens. In a descending channel, traders might increase short positions on pullbacks toward the resistance line.
- Consolidation Breakout in Horizontal Channel
- Description: In a horizontal channel, traders wait for a decisive breakout from the range to determine the next trend direction.
- Application: If the price breaks above the horizontal resistance, it could indicate the start of an uptrend, offering a buying opportunity. Conversely, a breakdown below the horizontal support may signal the start of a downtrend, making it a suitable time to short-sell.
Advantages and Limitations of Price Channels
Advantages
- Clarity in Trend Identification: Price channels help traders visualize trends clearly, allowing them to identify whether the asset is in an uptrend, downtrend, or sideways movement.
- Simple Entry and Exit Points: The support and resistance levels provide clear entry and exit points, making it easier to develop a trading plan.
- Versatility Across Timeframes: Price channels work well across different timeframes, making them useful for day traders, swing traders, and long-term investors.
Limitations
- False Breakouts: Breakouts from price channels can sometimes be false, leading to potential losses if traders enter positions based on these moves.
- Subjectivity in Drawing Channels: Accurately drawing price channels can be subjective, as different traders might interpret price action differently.
- Not Suitable for All Market Conditions: Price channels work best in trending or range-bound markets but are less effective in highly volatile conditions where prices do not move predictably.
Example of Using Price Channels
Suppose a trader identifies an ascending channel in the Bitcoin chart. As the price touches the lower support line, they enter a buy position, anticipating a bounce back toward the upper resistance line. The trader sets a stop-loss just below the support line to manage risk. As the price rises and reaches the upper resistance line, the trader exits the position, securing a profit.
Later, the price breaks above the resistance line of the ascending channel, indicating a potential trend continuation. The trader re-enters a buy position, expecting further upside, and places a stop-loss below the breakout level to minimize losses if the breakout fails.
Conclusion
Price channels are a fundamental tool in technical analysis, helping traders identify trends, track price movement within defined ranges, and set strategic entry and exit points. Whether in an uptrend, downtrend, or sideways market, price channels provide valuable insights into market behavior and assist traders in capturing potential gains.
By combining price channels with other indicators, like volume and momentum indicators, traders can improve the accuracy of their trades and make more informed decisions. While price channels have limitations, mastering their use can give traders an edge in navigating market trends and optimizing their trading strategies.


