Flag Patterns: Bullish and Bearish Signals
Bull Flags vs Bear Flags: A Comprehensive Guide to Trading Patterns

Bullish and Bearish Flag Patterns: Key Indicators for Market Trends
Flag patterns are important continuation patterns in technical analysis that signal a temporary pause in the market trend before it resumes in the same direction.
These patterns are characterized by a sharp price movement known as the flagpole, followed by a consolidation period that forms the flag or pennant. Once the consolidation phase ends, the price typically continues in the direction of the previous trend, either bullish or bearish.
Chart patterns like Flag Patterns and the Cup and Handle Pattern are essential tools for traders to identify potential price movements. Learn more about the Cup and Handle Pattern and how it complements flag patterns in trading strategies.
Let’s explore the market conditions in which bullish and bearish flag patterns appear and how they reflect the psychology of market participants.
Bullish Flag Patterns: Continuation in an Uptrend
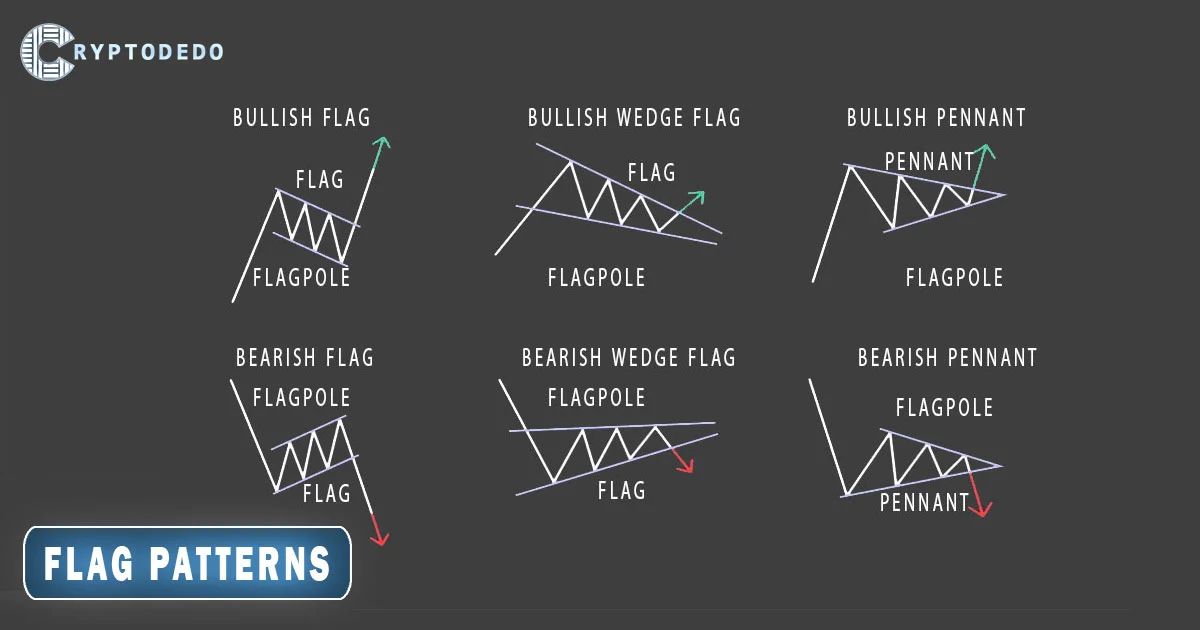
A bullish flag pattern forms when the market is in a strong uptrend, and it indicates that the price is likely to continue upward after a brief period of consolidation. Here’s how this pattern develops in the market:
- Flagpole Formation: The flagpole is created by a sharp price increase due to strong buying pressure. This move is often fueled by positive news, strong fundamentals, or overwhelming market optimism.
- Consolidation (Flag or Pennant): After the rapid rise, the price enters a consolidation phase, moving sideways or slightly downward in a parallel or wedge-shaped channel (flag). This pause is a reflection of traders taking profits or the market briefly stabilizing after the strong move. However, there isn’t enough selling pressure to reverse the trend, and buyers remain in control.
- Breakout: The pattern completes when the price breaks out of the flag’s upper trendline or the pennant, signaling a continuation of the previous uptrend. Traders often take this as a signal to enter long positions, expecting the bullish momentum to continue.
Bullish Wedge Flag and Bullish Pennant
- Bullish Wedge Flag: This is a variation of the flag pattern, where the consolidation occurs within a narrowing wedge shape. The flag’s trendlines converge slightly, indicating a gradual loss of momentum before a breakout.
- Bullish Pennant: The pennant is a more compact triangular consolidation pattern that forms after a sharp upward move. It signals the same continuation but in a more compressed price range.
Market Conditions for Bullish Flags
The bullish flag typically forms in bullish markets or uptrends when buying pressure remains dominant. Traders expect the price to continue rising after the consolidation, often driven by strong fundamentals, positive sentiment, or news that boosts market confidence.
Bearish Flag Patterns: Continuation in a Downtrend
A bearish flag pattern forms when the market is in a strong downtrend, and it signals that the price is likely to continue downward after a brief period of consolidation. Here’s how the pattern unfolds in the market:
- Flagpole Formation: The flagpole is created by a sharp decline in price, often driven by strong selling pressure, negative news, or deteriorating fundamentals.
- Consolidation (Flag or Pennant): After the rapid fall, the price consolidates, moving sideways or slightly upward in a parallel or wedge-shaped channel (flag). This brief upward movement represents traders temporarily covering short positions or market participants taking profits. However, the selling pressure is still dominant, and the price remains below key resistance levels.
- Breakdown: The pattern is complete when the price breaks below the flag’s lower trendline or the pennant, signaling the continuation of the previous downtrend. Traders often enter short positions at this point, expecting the bearish momentum to resume.
Bearish Wedge Flag and Bearish Pennant
- Bearish Wedge Flag: In this version, the consolidation occurs in a narrowing wedge, signaling a slight weakening of momentum before the price resumes its downtrend.
- Bearish Pennant: The pennant is a compact triangular consolidation pattern that forms after a sharp downward move, signaling a continuation of the bearish trend after the consolidation phase.
Market Conditions for Bearish Flags
The bearish flag forms in bearish markets or downtrends when selling pressure is strong. Traders expect the price to continue falling after the consolidation period. This pattern often appears when negative sentiment, weak fundamentals, or economic events drive the market lower, and sellers maintain control after a brief pause.
Flag Patterns: Key Characteristics
- Trend Strength: The strength of the preceding trend (flagpole) is key. The sharper and more pronounced the move leading to the flag, the stronger the potential breakout or breakdown.
- Volume: Volume typically decreases during the consolidation phase (flag or pennant) and then spikes during the breakout or breakdown, confirming the pattern. A volume surge signals that traders are committing to the next leg of the move.
- Market Sentiment: Flag patterns generally occur when market sentiment is aligned with the prevailing trend. In bullish flags, optimism and buying interest remain strong, while in bearish flags, fear and selling pressure dominate.
- Continuation Pattern: Flag patterns are continuation patterns, meaning that they indicate a brief pause in the trend before it resumes. They do not signal reversals but rather a temporary consolidation before the market continues in its current direction.
Conclusion
Flag patterns (both bullish and bearish) occur in trending markets and serve as signals that the price is likely to continue in the direction of the current trend after a brief consolidation phase.
Bullish flags form in bullish markets during an uptrend, signaling that the price is likely to continue rising after a pause.
Bearish flags form in bearish markets during a downtrend, indicating that the price is likely to continue falling after a brief consolidation.
Traders use flag patterns to identify opportunities to enter trades in the direction of the prevailing trend, often waiting for a breakout (in the case of bullish flags) or a breakdown (in the case of bearish flags) before making their move. Understanding these patterns and the market conditions in which they occur can help traders better anticipate price movements and make more informed trading decisions.


