Elliott Wave Patterns Explained for Crypto Traders
Elliott Wave: A Beginner’s Guide for Crypto Trading
Crypto Forecasting with Elliott Wave Theory
Introduction:
The Elliott Wave Theory is a powerful technical analysis tool that helps traders predict market cycles by analyzing patterns in market trends. Developed by Ralph Nelson Elliott in the 1930s, this theory is based on the idea that markets move in repetitive cycles, primarily driven by the psychology and behavior of traders. By understanding and applying Elliott Wave Theory, traders can anticipate potential future price movements and make more informed trading decisions.
Combining Elliott Wave Theory with Fibonacci trading strategies can create a powerful approach to cryptocurrency market trading. Elliott Wave patterns help predict market cycles, while Fibonacci levels provide key areas for potential entry and exit points, making them a highly effective duo for traders seeking precision in timing and trend analysis. For a deeper understanding of Fibonacci’s role in trading, explore our detailed guide on Fibonacci trading strategies.
This article will cover the basics of Elliott Wave Theory, explain its core structure, and explore how traders can use it to identify trends and reversals in the market.
What is the Elliott Wave Theory?
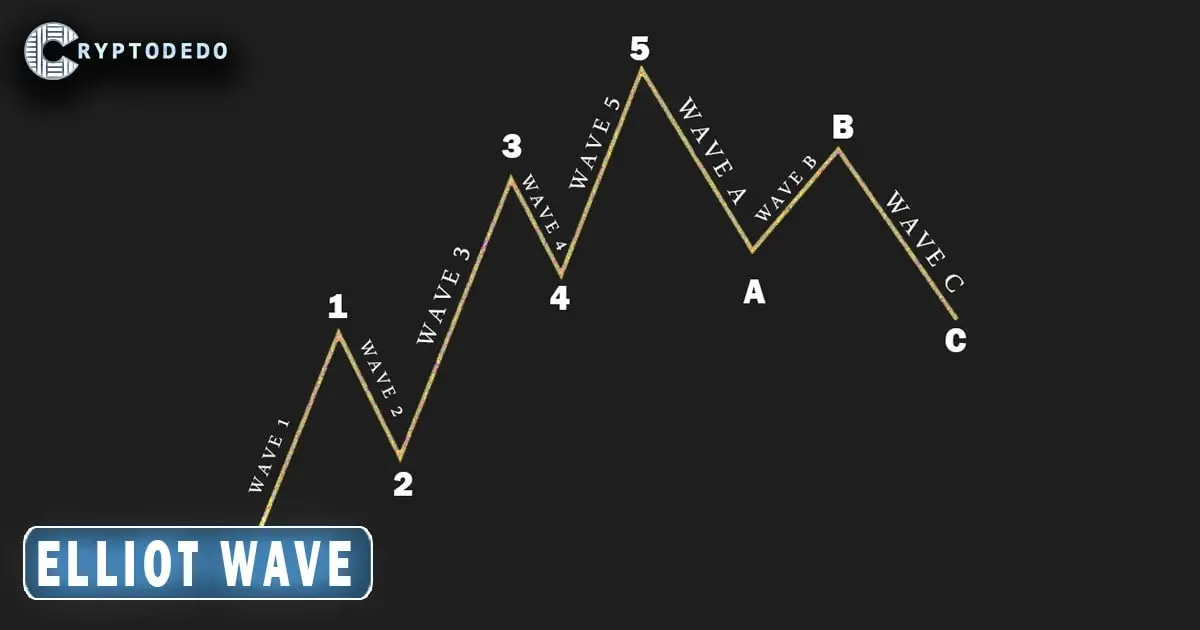
The Elliott Wave Theory suggests that financial markets move in a series of repetitive patterns known as “waves.” These waves reflect the collective psychology of market participants, with cycles of optimism, fear, and uncertainty. According to Elliott, market trends follow a predictable pattern of five waves in the direction of the main trend (impulse waves) and three waves in the opposite direction (corrective waves).
The theory is applicable across different timeframes, from minutes to months or even years, making it a versatile tool for both short-term and long-term traders.
Structure of Elliott Waves
The Elliott Wave Theory is divided into two main types of waves:
- Impulse Waves (5-Wave Pattern)
- Corrective Waves (3-Wave Pattern)
1. Impulse Waves
Impulse waves are the primary trend waves in a market cycle, moving in the same direction as the overall trend. An impulse wave consists of five sub-waves, labeled 1, 2, 3, 4, and 5.
- Wave 1: The trend begins to move in a new direction. This initial wave is often driven by a small group of traders and early adopters.
- Wave 2: The market retraces some of the previous gains as traders take profits, but the pullback remains limited, and the trend is not entirely reversed.
- Wave 3: This is usually the longest and strongest wave, as more traders recognize the trend and join in. The price often gains significant momentum in this phase.
- Wave 4: Another corrective phase, where the market consolidates, often due to profit-taking. This wave tends to be shorter than Wave 2.
- Wave 5: The final push in the direction of the trend, usually driven by market euphoria or “last buyers.” The price reaches its peak or low before entering a reversal.
2. Corrective Waves
Corrective waves follow the impulse waves and move in the opposite direction of the trend. They are structured as a 3-wave pattern, labeled A, B, and C. These corrective waves are seen as a pullback or retracement of the main trend.
- Wave A: The initial counter-trend move, where early signs of a reversal emerge.
- Wave B: Often a minor pullback against Wave A, as some traders believe the main trend will resume. However, this wave is usually weak.
- Wave C: A continuation of the reversal, breaking below Wave A and confirming the corrective pattern. This wave usually has a similar length to Wave A.
Elliott Wave Rules and Guidelines
To correctly identify Elliott Waves, traders should follow these rules and guidelines:
- Wave 3 cannot be the shortest impulse wave: Wave 3 is generally the longest and most powerful wave. If Wave 3 appears shorter than Waves 1 and 5, the pattern does not fit the Elliott Wave structure.
- Wave 4 does not overlap with Wave 1: In a typical Elliott Wave sequence, Wave 4 should not retrace back into the price range of Wave 1. If this happens, the structure is invalid.
- Wave 2 cannot retrace 100% of Wave 1: Wave 2 should not fall below the starting point of Wave 1. If it does, the pattern is likely incorrect.
These rules help traders accurately count waves and avoid misinterpretation of the pattern.
How to Apply Elliott Wave Theory in Trading
Applying Elliott Wave Theory requires practice and observation. Here are the steps to use this theory in real-world trading:
- Identify the Trend: Start by identifying whether the market is in a primary uptrend or downtrend. This will help you determine the direction of the impulse waves.
- Count the Waves: Begin counting waves from the start of the new trend. Look for the 5-wave structure in the direction of the trend (impulse waves) and the 3-wave structure in the corrective phase.
- Use Fibonacci Ratios: Fibonacci retracement and extension levels are often associated with Elliott Waves. Common retracement levels for corrective waves include 38.2%, 50%, and 61.8%, while impulse waves frequently extend to 161.8%, 200%, or even 261.8% of the initial wave.
- Confirm with Other Indicators: To strengthen your wave analysis, use additional technical indicators like RSI, MACD, or moving averages. These indicators can confirm trends, momentum, and possible reversal points, making your wave analysis more reliable.
- Look for Entry and Exit Points: Once the waves are identified, traders can plan entry and exit points. For example:
- Buy during Wave 2 or Wave 4 corrections for a lower-risk entry in the direction of the trend.
- Sell during Wave 5 to capture profits as the trend nears its peak.
- Enter short positions at the beginning of the corrective Wave A after a completed 5-wave impulse.
Advantages and Limitations of Elliott Wave Theory
Like any trading tool, the Elliott Wave Theory has both advantages and limitations:
Advantages
- Predictive Power: When applied correctly, Elliott Waves provide insight into potential future price movements, enabling traders to plan ahead.
- Works on Multiple Timeframes: The theory can be applied to various timeframes, making it versatile for day traders, swing traders, and long-term investors.
- Complements Other Tools: Elliott Wave analysis can be combined with other indicators to enhance trading decisions and increase confidence in trend predictions.
Limitations
- Subjective Interpretation: Counting waves can be subjective and open to interpretation. Traders may see different patterns in the same price action, leading to varied conclusions.
- Requires Practice: Mastering Elliott Wave Theory takes time and experience, as it involves recognizing complex patterns.
- No Guaranteed Accuracy: Like any technical tool, Elliott Waves are not always accurate and should be used in conjunction with risk management techniques.
Example of Elliott Wave in Action
Let’s assume you’re analyzing Bitcoin and notice a new uptrend beginning. You identify five waves moving upward, marking Waves 1 to 5. At Wave 5, the price begins to decline, forming Wave A, followed by a minor upward movement as Wave B, and finally a downward Wave C.
This complete 5-3 pattern signals the end of a cycle. Based on Elliott Wave Theory, you anticipate the market may soon resume its upward trend or enter a longer consolidation phase. By recognizing the end of the corrective waves, you plan your next trade, potentially entering at the start of a new impulse wave.
Conclusion
The Elliott Wave Theory is a comprehensive tool for understanding and predicting market behavior through patterns in price action. By analyzing waves and understanding their structure, traders can identify potential trends and reversals, making better trading decisions.
While Elliott Wave Theory requires patience, practice, and careful observation, it is a valuable asset for those who master it. Using it alongside other technical indicators and following a disciplined approach can significantly enhance trading outcomes in volatile markets like cryptocurrency.
By learning to recognize and apply the principles of Elliott Wave Theory, traders can gain a deeper insight into market movements, turning complex price patterns into actionable strategies.

