Butterfly Pattern in Trading: A Beginner’s Guide
How to Use the Butterfly Pattern for Profits

Butterfly Pattern Simplified for Traders
The Butterfly Pattern is a popular harmonic trading pattern that helps traders predict potential price reversals. This advanced technical pattern relies on Fibonacci retracement and extension levels to identify precise turning points in the market. The Butterfly pattern is unique because it often forms at the end of an extended price move, offering traders an opportunity to enter positions just before a reversal.
This article will explore the structure of the Butterfly pattern, including both bullish and bearish variations, explain the significance of Fibonacci ratios in the pattern, and discuss strategies for trading it effectively.
What is the Butterfly Pattern?
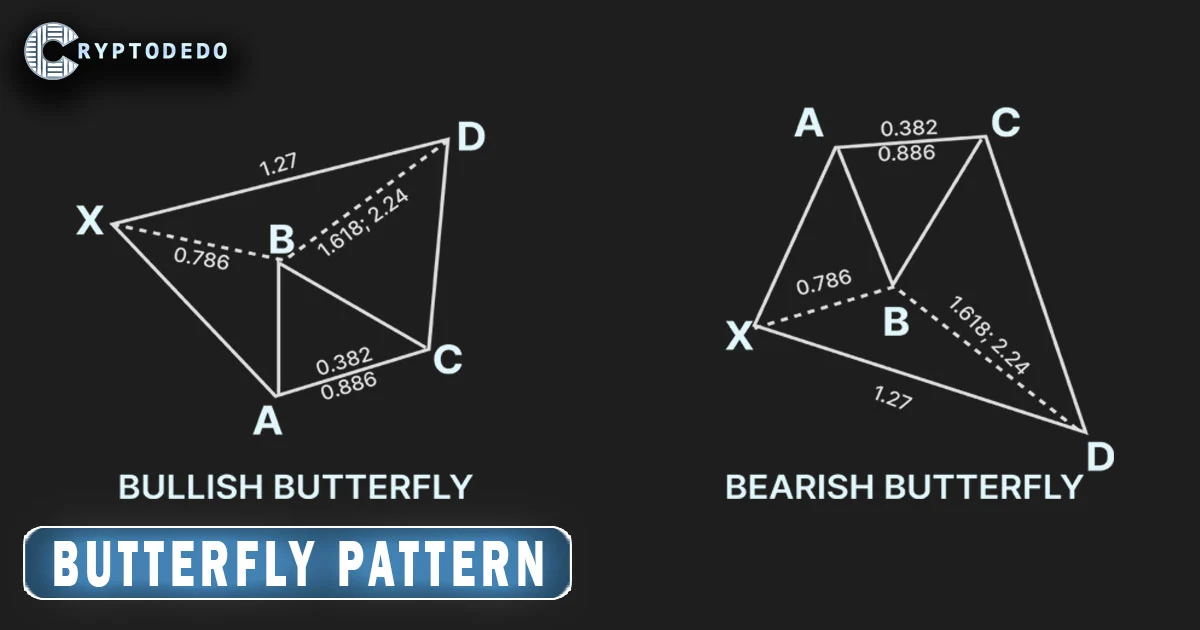
The Butterfly pattern is a four-leg harmonic chart pattern that signals potential reversals at extreme price levels. It consists of four distinct price swings, labeled as X-A, A-B, B-C, and C-D, each having a specific relationship with the previous leg based on Fibonacci ratios.
The Butterfly pattern has two main variations:
- Bullish Butterfly: Indicates a potential buying opportunity at the end of a bearish trend.
- Bearish Butterfly: Suggests a potential selling opportunity at the end of a bullish trend.
Both variations rely on Fibonacci levels for accuracy, helping traders pinpoint entry and exit points with minimal risk.
Structure of the Butterfly Pattern
The Butterfly pattern consists of four main legs: X-A, A-B, B-C, and C-D. Each leg has specific Fibonacci retracement and extension levels that define the pattern. Here’s a breakdown of each leg:
- X-A: The initial price move, either upward or downward, forms the first leg of the pattern.
- A-B: The price retraces from the X-A leg, reaching 78.6% of the X-A move. This retracement is critical to the pattern, as it establishes the structure’s overall size.
- B-C: After completing the A-B retracement, the price swings back in the opposite direction. The B-C leg should retrace between 38.2% and 88.6% of the A-B move.
- C-D: The final leg of the pattern is an extension of the B-C leg, typically reaching 127% to 161.8% of the X-A leg. Point D represents the completion of the pattern and a potential reversal point.
The Butterfly pattern’s validity depends on precise Fibonacci levels. If any leg deviates significantly from these ratios, it may invalidate the pattern, reducing its reliability.
Fibonacci Ratios in the Butterfly Pattern
Fibonacci retracement and extension levels are fundamental to the Butterfly pattern. Here’s how each ratio applies:
- 78.6% Retracement: The A-B leg retraces 78.6% of the X-A move. This ratio is crucial as it defines the structure’s depth.
- 38.2%–88.6% Retracement: The B-C leg should retrace between 38.2% and 88.6% of the A-B move, providing flexibility within this range.
- 127%–161.8% Extension: The C-D leg extends beyond the X-A leg, often reaching 127% or 161.8% of X-A. This extension is the final confirmation point, indicating a potential reversal at D.
Using these ratios correctly helps traders identify the pattern with accuracy, providing a reliable basis for entry and exit decisions.
Types of Butterfly Patterns
1. Bullish Butterfly Pattern
The Bullish Butterfly pattern appears at the end of a downtrend and signals a potential upward reversal. Here’s how it’s structured:
- X-A: A strong initial downward movement.
- A-B: A retracement upward to 78.6% of the X-A leg.
- B-C: A downward retracement of 38.2% to 88.6% of the A-B leg.
- C-D: An upward extension to 127% or 161.8% of the X-A leg.
At point D, traders expect a reversal to the upside, providing an opportunity to enter a long position.
2. Bearish Butterfly Pattern
The Bearish Butterfly pattern forms at the end of an uptrend and suggests a potential downward reversal. Its structure is as follows:
- X-A: A strong initial upward movement.
- A-B: A retracement downward to 78.6% of the X-A leg.
- B-C: An upward retracement of 38.2% to 88.6% of the A-B leg.
- C-D: A downward extension to 127% or 161.8% of the X-A leg.
At point D, traders anticipate a reversal to the downside, making this an ideal setup for entering a short position.
How to Trade the Butterfly Pattern
Trading the Butterfly pattern involves identifying the setup, confirming it with Fibonacci ratios, and executing a trade at the right time. Here’s a step-by-step guide to trading both the bullish and bearish Butterfly patterns:
- Identify the Pattern
Look for the initial X-A movement, followed by retracements and extensions that align with Fibonacci ratios. Draw trendlines to mark each leg and verify that the retracements match the expected levels. - Confirm with Fibonacci Levels
Use Fibonacci retracement and extension tools to confirm the ratios of each leg. If the pattern matches the structure of a valid Butterfly, it’s a potential trade setup. - Entry Point
Enter the trade at point D, where the pattern is expected to complete. For a bullish Butterfly, enter a long position at D. For a bearish Butterfly, enter a short position at D. - Stop-Loss Placement
Place a stop-loss slightly beyond point D to manage risk. If the price moves past D, it could invalidate the pattern, making the trade setup less reliable. - Take-Profit Target
Set your take-profit target at key Fibonacci retracement levels of the C-D move. Common levels for profit-taking include the 38.2%, 50%, and 61.8% retracements of the C-D leg. Adjust the target based on the asset’s momentum and market conditions. - Monitor for Confirmation Signals
To increase the probability of success, look for additional confirmation signals, such as candlestick patterns, RSI divergence, or volume increases near point D. These signals can strengthen the case for a reversal at the completion point.
Example of a Butterfly Pattern Trade
Imagine a stock that has been in a downtrend. After a sharp decline (X-A), the price retraces up to 78.6% (A-B), followed by another downward move retracing 50% of A-B (B-C). The final leg extends upward to 127% of X-A, forming the C-D leg. The pattern now resembles a Bullish Butterfly.
As the price reaches point D, a trader enters a long position with a stop-loss slightly below D to manage risk. The price begins to reverse, and the trader sets a take-profit target at 50% of the C-D leg retracement. This example illustrates how traders use the Butterfly pattern to capture reversals with minimal risk.
Advantages and Limitations of the Butterfly Pattern
Advantages
- Precision: The Butterfly pattern provides precise entry and exit points based on Fibonacci levels, allowing for low-risk trade setups.
- Clear Structure: The pattern has a well-defined structure, making it easier for traders to identify potential reversals.
- Flexibility: The Butterfly pattern works on multiple timeframes, making it suitable for short-term and long-term trades.
Limitations
- Complexity: Identifying and confirming the Butterfly pattern can be challenging, especially for beginners.
- Reliance on Fibonacci Ratios: The pattern’s accuracy depends heavily on correct Fibonacci ratios, requiring precise measurement.
- Potential for False Signals: Like all harmonic patterns, the Butterfly pattern is not foolproof and can sometimes produce false signals, especially in volatile markets.
Tips for Trading the Butterfly Pattern
- Practice Identifying the Pattern: Use historical charts to practice spotting Butterfly patterns. Familiarity with the pattern’s structure will help you identify it accurately in real-time.
- Combine with Other Indicators: Use indicators like RSI, MACD, or volume to confirm the reversal at point D. Confluence with other indicators strengthens the trade setup.
- Be Patient: Wait for the pattern to complete before entering a trade. Premature entries can expose you to unnecessary risk if the pattern doesn’t fully develop.
- Set Realistic Profit Targets: Don’t aim for excessive profits. The best approach is to take partial profits at conservative retracement levels and let the rest of the trade ride if the trend is strong.
Conclusion
The Butterfly pattern is a powerful harmonic tool for traders seeking to capitalize on price reversals at extreme levels. By understanding its structure, mastering Fibonacci ratios, and following a disciplined trading plan, traders can use the Butterfly pattern to identify high-probability trade setups.
While it requires skill and practice to implement correctly, the Butterfly pattern offers traders a precise method for spotting reversal points and managing risk effectively. With experience and careful application, the Butterfly pattern can become an invaluable addition to any trader’s strategy toolkit.


