Bull and Bear Traps: Recognize and Avoid Losses
Avoid Costly Bull and Bear Traps in Markets

How to Detect Bull and Bear Traps for Safe Trading
Introduction: In trading, not every breakout is genuine. Bull and bear traps are common market setups that trick traders into taking positions based on false breakouts, leading to potential losses. These traps occur when the price appears to break through a support or resistance level, only to reverse direction shortly after, catching traders off guard.
Identifying bullish and bearish candlestick patterns is a fundamental skill for recognizing bull and bear traps in trading. Explore our comprehensive guide on candlestick patterns to strengthen your understanding of these market indicators before tackling traps.
This article will explain bull and bear traps, how they form, and strategies to identify and avoid these deceptive setups in trading.
What is a Bull Trap?
A bull trap occurs in an uptrend or during a potential reversal from a downtrend. In a bull trap:
- The price moves above a resistance level, giving the impression of a breakout.
- Traders take long positions, expecting the uptrend to continue.
- Shortly after, the price reverses back below the resistance level, trapping those who entered long positions at the breakout.
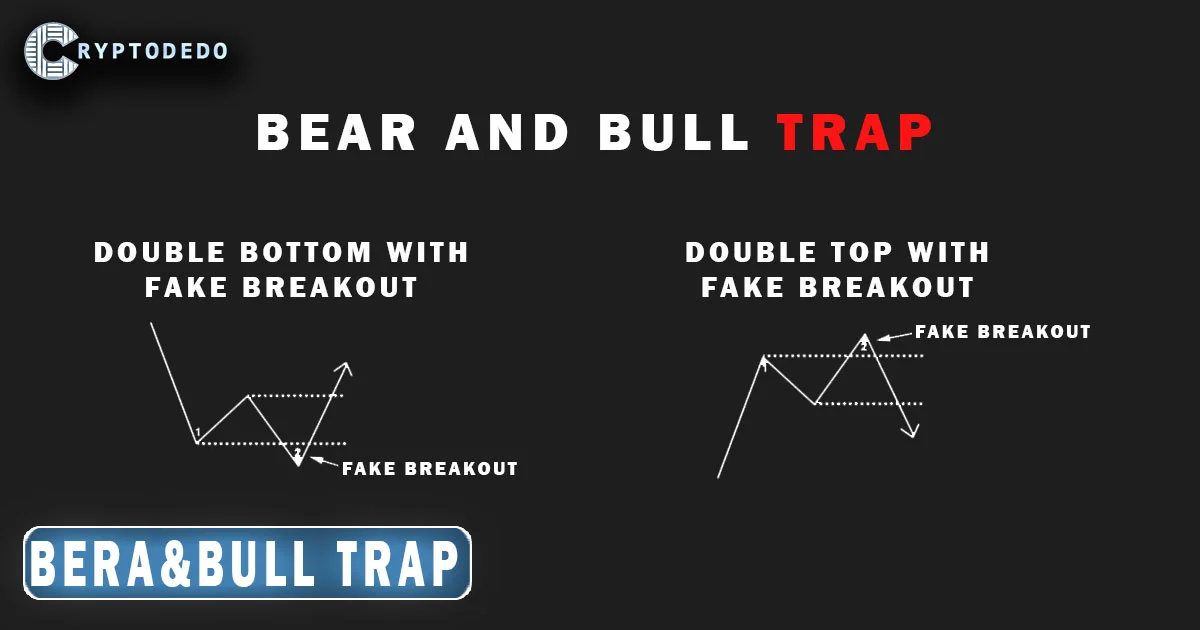
Bull traps often happen near double tops, head and shoulders patterns, or key resistance levels, where traders expect a bullish breakout.
Example of a Bull Trap: In a typical bull trap scenario, a stock or cryptocurrency appears to break through a previous high, enticing traders to buy. However, the price fails to sustain the upward momentum, reverses, and falls below the resistance level, catching buyers in a losing position.
What is a Bear Trap?
A bear trap occurs in a downtrend or when a potential reversal from an uptrend is expected. In a bear trap:
- The price moves below a support level, signaling a potential breakdown.
- Traders open short positions, expecting further downward movement.
- The price then reverses, climbing back above the support level and forcing short-sellers to exit at a loss.
Bear traps commonly occur near double bottoms, descending triangles, or other patterns where traders anticipate a bearish breakdown.
Example of a Bear Trap: In a bear trap setup, the price dips below a previous low, leading traders to believe the downtrend will continue. After entering short positions, the price unexpectedly rebounds, pushing back above the support level and forcing short-sellers to cover at a loss.
Why Do Bull and Bear Traps Occur?
Bull and bear traps often occur due to psychological factors and market manipulation. Some reasons include:
- Market Sentiment and Psychology: Traders often enter positions based on trends and breakouts, leading to herd behavior. When many traders expect a breakout or breakdown, the market can exploit this by reversing direction, trapping those who followed the crowd.
- Institutional Manipulation: Large institutions or “smart money” can manipulate price movements to take advantage of retail traders. By pushing the price slightly above or below key levels, institutions can create traps that cause inexperienced traders to buy or sell prematurely.
- Low Liquidity or Volatility: In markets with low liquidity or high volatility, prices can move unpredictably, creating false breakouts. Traders may find themselves caught in traps due to erratic price movements.
How to Identify Bull and Bear Traps
Recognizing potential bull and bear traps can save traders from entering losing trades. Here are key methods to identify these traps:
- Wait for Confirmation: Avoid entering a trade immediately after a breakout or breakdown. Wait for the price to close beyond the support or resistance level for confirmation. For example, in a bullish breakout, wait for a strong close above resistance, and in a bearish breakdown, wait for a close below support.
- Analyze Volume: Fake breakouts often occur with low or declining volume. When the price moves past a key level with low volume, it may lack the strength needed to sustain the trend, increasing the chances of a trap.
- Look for Divergence: Use indicators like the Relative Strength Index (RSI) or MACD to check for divergence. If the price breaks out but momentum indicators show weakness or divergence, it could be a trap. For instance, if the price makes a higher high but RSI makes a lower high, it may indicate a bull trap.
- Check for Candlestick Patterns: Reversal patterns like doji, shooting stars, or bearish/bullish engulfing patterns near key levels can signal a trap. These patterns indicate indecision and potential reversals, warning traders to be cautious.
- Use Multi-Timeframe Analysis: Analyze multiple timeframes to get a clearer view of the breakout. A breakout on a smaller timeframe may not be as significant as a breakout on a larger timeframe. Checking higher timeframes helps confirm if the breakout is genuine.
- Beware of Key News Events: Major news announcements or economic data releases can cause volatile and unpredictable price movements, increasing the chances of traps. Traders should avoid taking positions solely based on breakouts around such events.
Trading Strategies to Avoid Bull and Bear Traps
- Wait for Retests
Instead of entering immediately after a breakout, wait for the price to retest the support or resistance level. If the breakout is genuine, the price will likely hold above the resistance (in a bull trap) or below the support (in a bear trap) on the retest. Retests provide an additional layer of confirmation. - Use Stop-Loss Orders
Always set stop-loss orders to manage risk. For a long position after a breakout, place a stop-loss just below the breakout level to minimize losses if it turns out to be a bull trap. For a short position, place a stop-loss just above the breakdown level to protect against bear traps. - Diversify with Indicators
Combine breakout analysis with indicators like RSI, MACD, or Moving Averages. For instance, if you see a breakout accompanied by strong RSI and volume, the chances of a trap are lower. Conversely, low volume and weak momentum indicators suggest the breakout may be false. - Avoid Trading Near Overbought or Oversold Levels
Bull and bear traps are more likely near extreme overbought or oversold levels. If RSI, for example, is over 70 (overbought) and a bullish breakout occurs, it’s safer to avoid the trade as a bull trap is more likely. Similarly, if RSI is under 30 (oversold) during a bearish breakdown, a bear trap could be forming.
Real-World Example of a Bull and Bear Trap
- Bull Trap Example: In a stock or cryptocurrency, the price reaches a previous resistance level and breaks above it, prompting traders to enter long positions. However, shortly after the breakout, the price falls back below the resistance level, resulting in losses for traders who anticipated a breakout.
- Bear Trap Example: In another instance, the price falls to a previous support level and breaks below it, encouraging traders to go short. But shortly after, the price rebounds above the support level, causing losses for those who shorted the asset.
Both traps are illustrated in the image, showing how a double top with a fake breakout creates a bull trap and a double bottom with a fake breakout creates a bear trap. These examples emphasize the importance of confirming breakouts before entering positions.
Conclusion
Bull and bear traps are common in trading and can result in significant losses if not recognized. By waiting for confirmation, analyzing volume and momentum, and using technical indicators, traders can minimize the risk of falling into these traps. Patience and discipline are essential for identifying genuine breakouts and avoiding premature entries.
Understanding bull and bear traps is crucial for successful trading. By mastering these concepts and learning to spot false breakouts, traders can protect their capital and make more informed decisions, improving their overall trading performance.


