Triangle Patterns: Profitable Strategies
Triangle Patterns: Identifying Breakouts

Triangle Patterns: Mastering Market Trends
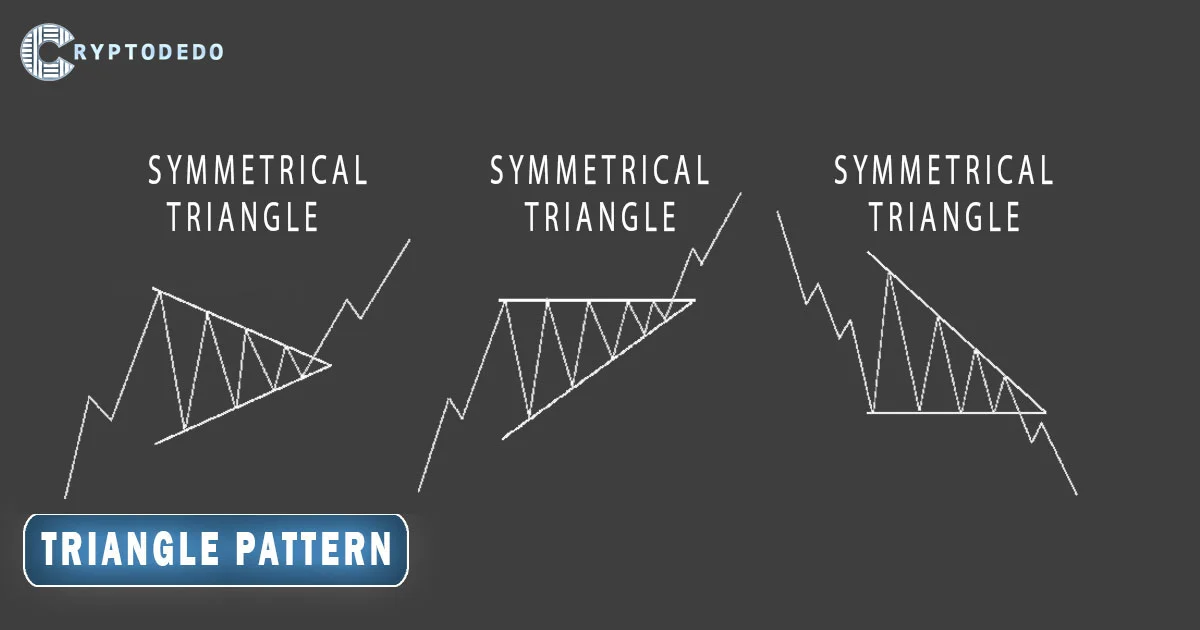
Symmetrical Triangle Patterns are continuation patterns that form during periods of consolidation in both bullish and bearish markets.
It reflects a balance of supply and demand, where neither buyers nor sellers have the upper hand, causing the price to fluctuate between converging trendlines. Eventually, the price breaks out in the direction of the prevailing trend, providing a signal for traders to anticipate future price movements.
At the beginning of this article, it’s essential to explore the Triple Top and Triple Bottom Patterns. These patterns, like triangle patterns, play a crucial role in technical analysis, helping traders identify potential market reversals and continuation signals effectively.
Symmetrical Triangle Patterns Explained
The Symmetrical Triangle consists of two trendlines:
A descending upper trendline that connects a series of lower highs.
An ascending lower trendline that connects a series of higher lows.
As the price moves within this narrowing range, volatility decreases, and the pattern resembles a triangle. These patterns are neutral, meaning they can break out either upwards or downwards, but typically, they continue in the direction of the existing trend.
Market Conditions Leading to Symmetrical Triangle Patterns Formation
The Symmetrical Triangle pattern forms when the market is in a consolidation phase. This happens after a significant price move, when the market takes a “breather” before continuing the trend. Here are the typical market conditions for its formation:
1. In Bullish Market Conditions:
Previous Uptrend: In a bullish market, symmetrical triangle patterns usually form after an uptrend, as buyers take profits and new participants wait to enter. The price fluctuates between lower highs and higher lows, reflecting a period of indecision.
Breakout to the Upside: As the price approaches the apex of the triangle, the tension between buyers and sellers resolves, and the price often breaks out in the direction of the previous trend, leading to a continuation of the bullish move. Traders typically look for an upside breakout as a signal to enter long positions.
2. In Bearish Market Conditions:
Previous Downtrend: In a bearish market, symmetrical triangle patterns form after a downward move, as sellers take profits and buyers hesitate to step in. The price moves within the narrowing range of the triangle, creating a pattern of lower highs and higher lows.
Breakdown to the Downside: If the breakout happens in the direction of the prior downtrend, it signals a continuation of the bearish market, and traders may enter short positions. A downward breakout from the symmetrical triangle confirms the continuation of selling pressure.
Factors Influencing Symmetrical Triangle Patterns Breakouts
While the Symmetrical Triangle can break out in either direction, several factors influence the likelihood of an upward or downward breakout:
Trend Strength: The strength of the prior trend plays a critical role in determining the breakout direction. If the market was in a strong uptrend or downtrend before the pattern formed, the breakout is likely to continue in the same direction.
Volume: Volume tends to decrease as the price moves toward the apex of the triangle. A breakout accompanied by a spike in volume confirms the validity of the pattern and signals a strong continuation of the trend.
Market Sentiment: External factors such as news, earnings reports, or economic data releases can trigger a breakout, especially if these events align with the prevailing trend.
Trading Strategies Using Symmetrical Triangle Patterns
To trade symmetrical triangle patterns, traders often wait for a confirmed breakout to reduce the risk of false signals. Key strategies include:
Entry Points: Traders typically enter the market after the price breaks above or below the triangle’s trendlines. For bullish continuation, they enter long positions after an upward breakout, while for bearish continuation, they enter short positions after a downward breakout.
Stop Loss Placement: A stop-loss is usually placed just outside the opposite side of the triangle to limit losses if the breakout fails or reverses.
Target Price: The target price is often calculated by measuring the height of the triangle at its widest point and projecting that distance from the breakout point.
Conclusion
Symmetrical triangle patterns occur in both bullish and bearish market conditions, acting as a continuation signal after a period of consolidation.
In a bullish market, they suggest the uptrend may resume after consolidation, while in a bearish market, they indicate that the downtrend could continue. Recognizing symmetrical triangle patterns in different market conditions helps traders capitalize on breakouts and manage risk more effectively.


