Head and Shoulders Pattern: A Complete Guide for Traders
How to Identify and Trade the Head and Shoulders Pattern

Head and Shoulders Pattern in Technical Analysis
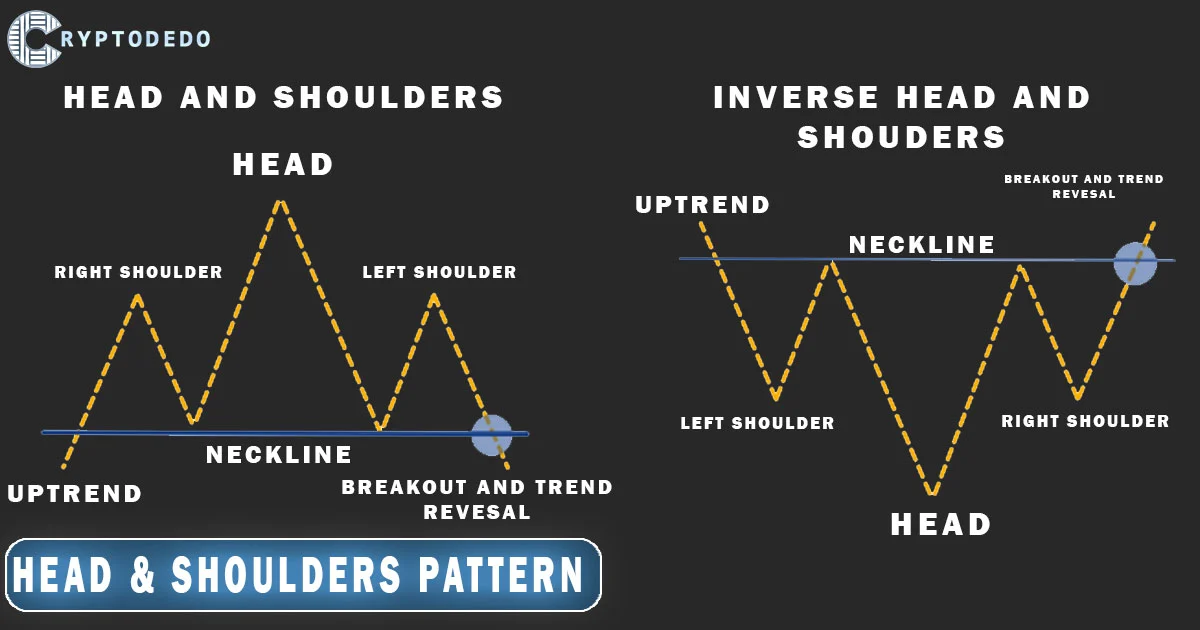
The Head and Shoulders pattern is one of the most well-known and reliable chart patterns in technical analysis, often used by traders to predict market reversals. It consists of three peaks: the left shoulder, the head, and the right shoulder, and is followed by a breakout once the neckline is breached. This pattern can signal either a bullish or bearish trend reversal, depending on its formation.
In this article, we’ll explore both the standard Head and Shoulders pattern and its Inverse Head and Shoulders variant, highlighting their characteristics and significance in predicting trend changes.
1. Standard Head and Shoulders Pattern (Bearish Reversal)
The Head and Shoulders pattern forms in an uptrend and typically signals a reversal to a downtrend. This pattern is easily identifiable with three peaks:
Left Shoulder: Forms as the price rises to a peak and then retraces.
Head: The price rises again, reaching a higher peak than the left shoulder, and retraces.
Right Shoulder: The price rises again but fails to surpass the height of the head, forming a lower peak.
A neckline is drawn by connecting the lows between the left shoulder, head, and right shoulder. When the price breaks below the neckline, it suggests a bearish breakout and a reversal of the uptrend. This breakout often signals a significant downward move.
Key Characteristics:
Forms during an uptrend.
Indicates a potential shift from a bullish to a bearish trend.
Break below the neckline signals a bearish reversal.
Target Price: The distance from the head to the neckline can be used to estimate the price movement following the breakout.
2. Inverse Head and Shoulders Pattern (Bullish Reversal)
The Inverse Head and Shoulders pattern, on the other hand, is a bullish reversal pattern. It forms in a downtrend and consists of the following components:
Left Shoulder: Forms as the price falls to a low and then rises.
Head: The price drops again, creating a lower low than the left shoulder before rising.
Right Shoulder: The price drops again but stays above the level of the head, forming a higher low.
The neckline is drawn by connecting the highs between the left shoulder, head, and right shoulder. When the price breaks above the neckline, it signals a bullish breakout and a reversal from the downtrend to an uptrend.
Key Characteristics:
Forms during a downtrend.
Signals a potential shift from a bearish to a bullish trend.
Break above the neckline suggests a bullish reversal.
Target Price: Similar to the standard pattern, the distance from the head to the neckline can help estimate the upward price movement after the breakout.
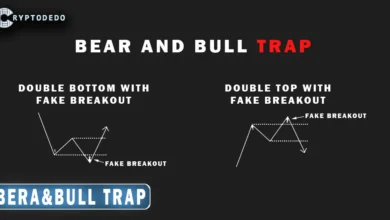
Similar reversal patterns, such as the Double Bottom and Double Top, can provide valuable insights into potential price direction shifts, helping traders enhance their strategies in various market conditions.
3. Significance of the Neckline
The neckline is an essential aspect of both the standard and inverse patterns. It represents a support or resistance level, and its breakout often confirms the pattern’s completion. In the standard Head and Shoulders pattern, a break below the neckline signals a bearish trend, while in the Inverse Head and Shoulders, a break above the neckline indicates a bullish trend reversal.
4. Practical Application for Traders
Both patterns are useful tools for traders to anticipate trend reversals. Here are key tips for using them effectively:
Confirmation: Wait for the price to break the neckline before entering a trade. This confirmation helps reduce the risk of false breakouts.
Volume Analysis: Often, an increase in volume during the breakout from the neckline strengthens the validity of the pattern.
Stop-Loss Placement: Traders usually place stop-loss orders above the right shoulder for the standard pattern (bearish setup) or below the right shoulder for the inverse pattern (bullish setup).
Target Price Calculation: To estimate potential price movement after the breakout, measure the distance between the head and the neckline and project it in the breakout direction.
Conclusion
The Head and Shoulders and Inverse Head and Shoulders patterns are powerful tools for identifying potential market reversals. Recognizing these patterns can provide traders with valuable insights into when a trend is likely to change direction, allowing them to make informed decisions about entering or exiting trades.
However, as with any trading strategy, it’s essential to combine these patterns with other technical indicators and risk management techniques to improve overall trading success.


